Establish a framework to monitor progress
Now that you have reviewed the evidence, considered local context and chosen your policy, it is time to determine how your city will monitor progress of this new approach. City staff and leaders need to establish the infrastructure for ongoing, continuous decision making based on whether the policy change is leading to the desired outcomes for residents and whether the change is meaningful and rational to front line workers. Setting arbitrary goals at the local level that conflict with goals at other levels is confusing to the individuals responsible for achieving the goals. Goals that are set too high to achieve can be demoralizing to staff.
This section includes steps to set up a venue in which City staff and leadership routinely visit key indicators to determine what is or is not working, and to make decisions in real-time. For more reading on performance management, please visit the GovEx Performance Management Getting Started Guide.
In performance management, terms such as indicator, measure, and metric may be used interchangeably. In this guide, we will use "indicator." In your work, the most important thing is to be consistent in whichever term you use. This video may be helpful in understanding this concept and communicating it to others.
Establish the fundamentals and gather your team
First, determine whether there is an established venue or regular meeting schedule during which you can discuss progress. If your city has an existing performance management structure on a related topic, adding a discussion of the progress of policy change to your agenda can be a great idea. If this will be a standalone meeting, decide how frequently the project team and decision makers will meet and put those meetings on the calendar for the entire length of the project.
Determine who will staff and attend routine meetings on City progress. These meetings may include the Mayor and/or City Manager, department head, staff who are implementing the policy change, and analysts.
Identify indicators
It is critical that indicators be an important city and community priority, as well as something the City plays a major role in addressing. There may be instances in which the City will need to reach out to or collaborate with external partners to get a more complete picture of progress on the overall policy change.
An outcome indicator describes the desired effect of the targeted population.
Example: Bellevue's family friendly neighborhoods indicator measures the percent of residents who believe they live in a neighborhood that supports families, particularly those with children.
With your key partners, revisit your problem statement, current state, and future state exercise, and begin to identify the outcome indicators that will illustrate success. For now, choose a single top-level key performance indicator (KPI). It is critical that the KPI - the piece you will measure - be a priority for the community and something the City plays a major role in addressing.
Output indicators measure the process of program or service delivery.
Example: San Diego Mayor Kevin Faulconer's goal to repair 1,000 miles of street by 2020.
Reviewing the administrative dataset inventory, begin to pare down the relevant programs and datasets that support your KPI. What are the measures of effectiveness for each program? These are your output indicators.
The diagram below illustrates the relationship between output and outcome indicators.
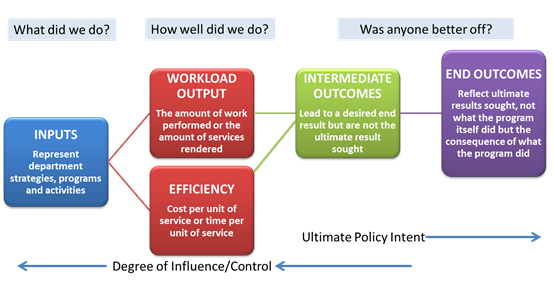
Think about implementation indicators as measuring steps in the program's roll out that are necessary to obtain desired changes. Implementation outcomes can focus on the intervention, staff delivering the intervention, an organization or system, and can address feasibility, adaptability, sustainability, and cost. Two key questions to consider when developing implementation indicators are:
Is the intervention acceptable and appropriate to the community; and
Is it feasible to implement intervention X at this time with these resources?
A more extensive list with definitions of potential implementation outcomes is linked here.
Use the table below to choose the desired implementation outcomes for your pilot and to plan your measurement technique. This should include level of analysis (individual provider or consumer, organization or setting), your measurement technique (surveys, observation, interview, focus groups, administrative data analysis), and the phase when you will collect this information (early, mid, late). There may be more than one level of analysis, measurement technique, and phase of data collection.
| Implementation outcome | Definition of outcome | Level of analysis and measurement | Your measurement technique | Phase of pilot when you will collect data |
|---|---|---|---|---|
Use the space below to capture your indicator wish list.
Indicator wish list:
Outcomes: _____________________________________________________________________________
Outputs: ________________________________________________________________________________
Implementation outcomes: ______________________________________________________________
Set a public, high-level goal
The high-level goal is critical in establishing direction to galvanize the people who will be doing the work. When discussing the goal, use the Mayor's bully pulpit. Look for key milestones in City government to share the goal statement, such as the beginning of a Mayoral administration, a State of the City speech, or other public remarks.
Goals should be “SMART.”
Specific as possible (in naming the population who will be better off, the action the city will take)
Measurable
Achievable
Results-focused
Time-bound
The goal statement should include your outcome indicator, like Chattanooga's goal, “We will end chronic veteran homelessness by December 2016.” A diagram to hep you build a SMART goal around your outcome indicator is below:
| Component | Description | Your turn |
|---|---|---|
| Specific | Who will be better off? What action the city will take? | |
| Measurable | How will you measure success? | |
| Achievable | Is the goal attainable? | |
| Results-focused | What is the expected result? | |
| Time-bound | When? |
Set realistic, ambitious targets and timelines for each indicator
To establish a realistic and ambitious target for your goal statement, use the administrative data collected for your chosen KPI to review actual City performance in the most recent year, compared with the three or four most recent year's worth of data. Begin to calculate summary statistics (e.g., total, minimum, average, median, maximum) to identify trends. Create cumulative and monthly charts to identify trends and anomalies. Based on your analysis of historical data, ignore the anomalies and assume the productivity trends will follow the same overall pattern from month-to-month. Finally, apply an increased productivity factor to the performance each month to forecast future progress. Based on this analysis, choose a target that inspires improvement while accounting for reality.
Many cities that are more mature in their performance management practices recognize the importance of taking a community-level approach to improving outcomes for residents. These cities are creating goal taxonomies that include measures related to public safety, housing, and even recreation. Cities drive progress on these goals by implementing strategies that engage multiple departments and collaborate with service providers in the community.
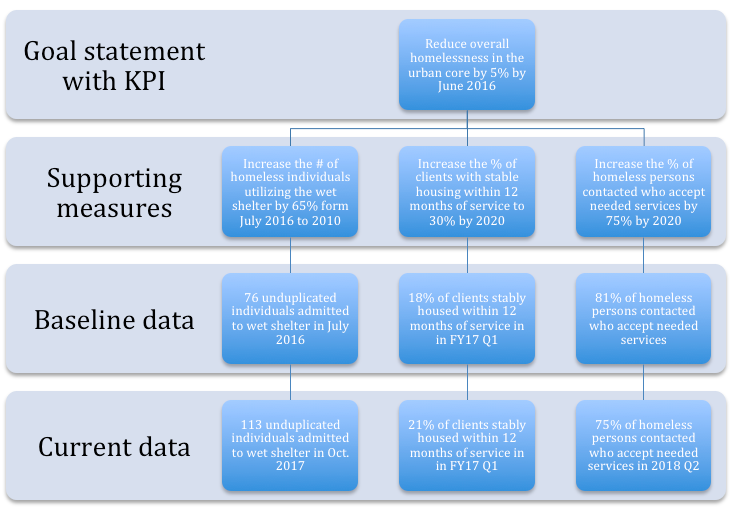
Eventually, you will develop goal statements for the outputs, in order to capture the effort to achieve the outcome contained in your goal statement. Your set of indicators should be composed of short- and interim-term supportive measures with accurate targets and relevant timelines. An example goal taxonomy from the City of Las Vegas's Results Vegas program is below. Use this taxonomy as a model for your own suite of indicators and goal statements.
Your turn
The template below is meant to help you craft a goal statement for each supporting measure.
| Goal statement: |
|---|
| Departments | |
|---|---|
| Outcome | |
| Activities | |
| KPI | |
| Target | |
| Timeframe |
Conduct and discuss relevant analysis
Through a routine series of meetings, continually monitor progress of KPIs, supporting indicators, and any other data collected such as qualitative data, to identify trends that will indicate whether the chosen policy is having the desired impact. These data points should drive the discussion during these meetings, pointing to opportunities for further inquiry into what is driving the observed trends. Analysts should be encouraged and trained to ask questions of the departments producing the data, and conduct site visits when possible to deepen their understanding of the data. Presentation of the analysis should focus on one idea at a time to keep the conversation focused on key points and specific opportunities for improvement. You may consider developing a public facing dashboard to share this progress more broadly.
A general comparison of the "status quo" data with what was observed during the pilot can provide decision makers with a quick understanding of the differences between the old and new approaches, although this will not show causality. Often, these comparisons will include operational metrics such as days or dollars saved, but remember that the impact on people will be most important. If you are working with an evaluation partner, they will support this step.
Use the space below to summarize the results of your analysis.
| Measure | Target value (see section on setting targets above) | Pilot value (what did you observe during the pilot) | Historical average (if available) |
|---|---|---|---|
| Results (Who is better off? Is anyone negatively impacted? 1-2 sentences reassessing your goal statement) |
|---|
Document your process and progress, including feedback from the participants, implementation partners, and the project team. Did anything unexpected occur during the pilot? Are there internal and external factors that may affect your outcomes? This is where the implementation outcomes can be can helpful. If the intervention did not go as planned, consider whether it is because the intervention was not acceptable or feasible
Use the template below, created by Denver's Peak Academy, to capture this information. If the 30, 60, 90 day timeline does not make sense for your city, feel free to customize it.
| Current State | Future State | 30 Day | 60 Day | 90 day | |
|---|---|---|---|---|---|
| What went well (+) | |||||
| What did not go well/should be changed (-) |
If a question or discussion point arises that cannot be answered in the meeting, an assigned staff member should capture the question during the meeting. Afterward, the follow up items should be sent to relevant partners and the next meeting should begin with a discussion of those items.
Take action
Discussions about whether your indicators are moving in the right direction and what might be driving trends, may lead to a discovery that there are not enough resources allocated to this policy or issue. There may be limited funding for staff, programming, or technology that is driving the data in the wrong direction. If City leadership is in the room, this is a great time to make the case for additional funding during the budget season. By collecting, analyzing, and discussing data on this policy routinely, you are building evidence to make the case for the right level of funding to reach the established targets.